· 4 min read
How Predictive Analytics Actually Works in Church Software
Predictive analytics in church software works by scoring every member against patterns of past disengagement, then flagging the ones whose behavior is quietly drifting before they disappear.
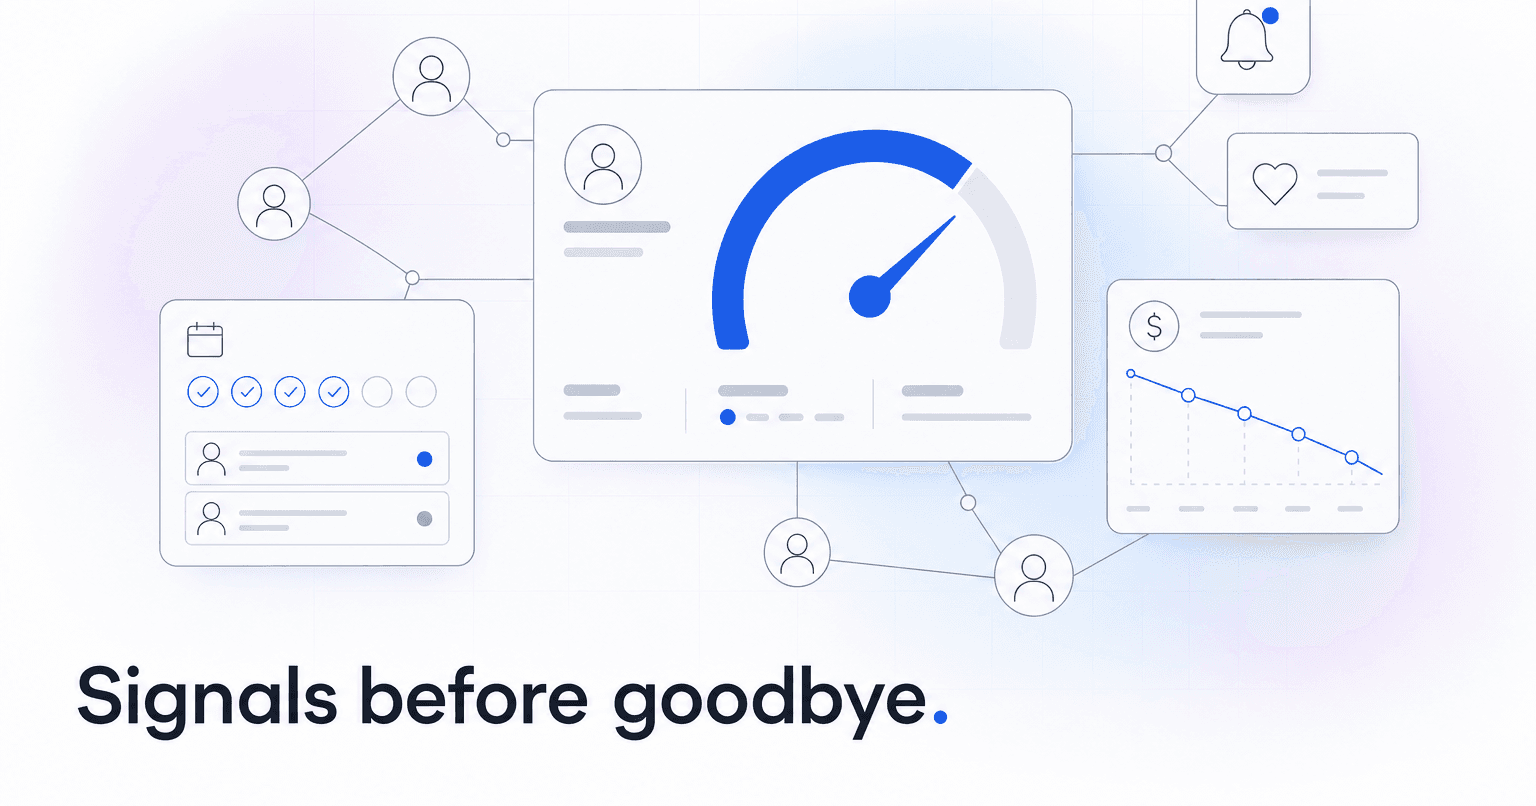
Predictive analytics in church software works by scoring every member against patterns of past disengagement, then flagging the ones whose behavior is quietly drifting before they disappear. The software ingests attendance check-ins, giving history, group participation, event RSVPs, and communication opens, learns what a typical "on-ramp to leaving" looks like inside your specific congregation, and produces a weekly list of names your team can actually call. That is the whole loop. The interesting part is what happens between "raw data" and "call this person on Tuesday", and most of it is unglamorous plumbing.
Here is what actually goes on under the hood, in the order it has to happen.
Step 1: Unifying the data that lives in five different tools
Nothing predictive works until a single member record can answer four questions at once: when did they last show up, when did they last give, when did they last serve, and when did they last respond to something you sent. In most churches that data lives in Planning Center for check-ins and teams, a giving processor for donations, Mailchimp or a similar tool for email, and a spreadsheet somewhere for small groups.
Predictive software starts by pulling all of that into one identity graph. That means matching "Mike Johnson" in Planning Center to "Michael Johnson" at the giving processor to "mjohnson@gmail.com" in the email tool, usually through fuzzy matching on name, phone, email, and household. Get this wrong and the model sees two half-engaged people instead of one fully engaged one. This is why platforms that pull from your existing ChMS, rather than asking you to migrate, tend to produce cleaner signals faster. If you want the migration angle, we walked through it in this case study.
Step 2: Turning behavior into features
Raw events (a check-in, a $50 gift, an email open) are not useful to a model on their own. They get converted into features, which are numeric descriptions of a person's pattern. A few that carry real weight:
- Attendance cadence: not "did they come last Sunday" but "what is their normal gap between visits, and is the current gap longer than usual for them". A monthly attender missing three weeks is a signal. A weekly attender missing three weeks is an emergency.
- Giving trajectory: rolling 90-day giving compared to their own trailing 12-month baseline, not compared to the church average. A donor who gave $400/month for two years and dropped to $150 last month is a stronger warning than a $20 giver going silent.
- Engagement breadth: how many distinct channels they touch (service, group, serving team, email, app). People engaged in three or more channels almost never leave without warning; people in one channel leave all the time.
- Response decay: open rates and RSVP rates over time. Falling response is often the earliest signal, showing up weeks before attendance drops.
Step 3: Training the model on your church, not a generic one
A model trained on "churches in general" is close to useless because a rural congregation of 180 behaves nothing like a suburban campus of 2,400. Good church software trains on your last 18 to 24 months of history: it looks at every member who lapsed and asks, "what did their data look like 60 days before they stopped coming?" Then it finds the patterns and applies them forward.
The output is usually a risk score from 0 to 100, updated weekly, with the top features driving that score exposed so your team knows why someone is flagged. "Attendance gap 2.3x normal + zero group activity in 45 days" is actionable. A bare number is not. We unpacked the scoring layer in more depth in how predictive analytics actually works in church membership software.
Step 4: Turning scores into an early-warning workflow
A dashboard nobody opens does not prevent attrition. The last mile is routing. That means: every Monday morning, the ten highest-risk members get assigned to a specific staff member or elder, with a suggested touch (personal text, coffee invite, prayer call) based on what channel that person actually responds to. The system then watches whether the touch shifted the score over the next 30 days, and feeds that back into the model.
This is where most homegrown "let's build a spreadsheet" attempts break down. Scoring is the easy 20%. Getting a follow-up in front of the right person at the right time, and closing the loop, is the 80%. We laid out the mechanics of that follow-up layer in this guide to automated visitor workflows.
What it takes to actually go live
Three things, in order: clean member identity across your existing tools, at least a year of historical behavior to train on, and a defined human workflow for what happens when someone is flagged. Software handles the first two. The third is a leadership decision, not a technical one, and it is the difference between a church that quietly loses 40 people a year and one that catches most of them in time.
If you want to see what this looks like running against your own data, ChurchAI plugs into Planning Center, Breeze, and CCB and produces a first risk list in about a week.
Common questions
- What is ChurchAI?
- ChurchAI is an AI-native church management platform built to help churches retain members, grow giving, and eliminate administrative busywork. Unlike legacy church software that stores data passively, ChurchAI acts as an intelligence layer that connects to your existing tools, analyzes engagement patterns, predicts churn, identifies emerging donors and volunteer leaders, and automates follow-up workflows.
- How is ChurchAI different from Planning Center or other church management software?
- Most church management software like Planning Center, Rock CHMS, or Subsplash are built for administration and reporting. They store data but don't act on it. ChurchAI is built for discipleship and growth. It uses AI to proactively surface insights, predict which members are at risk of leaving, identify first-time and emerging givers, recommend volunteer candidates, and trigger automated follow-up communications. ChurchAI integrates with your existing tools and serves as the command center that turns church data into action.
- Does ChurchAI replace my current church software?
- No. ChurchAI connects directly with your existing church tools including Planning Center, Rock CHMS, Subsplash, Mailchimp, Microsoft Fabric, Power BI, and others. It acts as the intelligence layer on top of your current tech stack, unifying data from scattered systems into one command center without requiring you to switch platforms.
- What problems does ChurchAI solve for churches?
- ChurchAI solves three core problems: (1) Member churn — it identifies disengaged members early through attendance and engagement pattern analysis, then triggers automated follow-up before people fall through the cracks. (2) Missed growth opportunities — it surfaces emerging donors, first-time givers, and potential volunteer leaders that pastors would otherwise miss. (3) Administrative overload — it automates follow-ups, people management, growth tracks, and reporting so church staff can focus on ministry instead of spreadsheets.
- What size churches does ChurchAI work for?
- ChurchAI works for churches of all sizes, from growing congregations to enterprise-level megachurches with multiple campuses and complex tech stacks. The platform scales to handle multi-campus operations with thousands of members, multiple data systems, and sophisticated reporting needs.
- Is ChurchAI an AI chatbot for churches?
- No. ChurchAI is not a chatbot or a simple Q&A tool. It is a full AI-native platform with intelligent agents that analyze church data, score member engagement, predict behavior patterns, automate workflows, and deliver actionable insights. Think of it as an AI-powered Executive Pastor that monitors church health 24/7 and proactively surfaces what needs attention.
- What AI technology does ChurchAI use?
- ChurchAI uses AI-native architecture including large language models, engagement scoring models, predictive analytics for churn and giving patterns, and automated workflow agents. The platform's domain expertise is encoded directly into its AI workflows, prompts, and scoring models, built by founders with over a decade of church leadership experience. This creates a data flywheel where the more churches use ChurchAI, the smarter its predictions and recommendations become.
- How do I get started with ChurchAI?
- Visit churchai.com to request a demo. The ChurchAI team will walk you through the platform, understand your current tech stack and church needs, and show how ChurchAI integrates with your existing tools to deliver immediate value.